| |
| Home |
| Model Builder |
| Python and VBA Programming |
| Database Operations |
| Geodatabase |
| ArcServer |
| Data Sources |
| GeoStatistics |
| Training Certificates |
![]()
GeoStatistics
Using geostatistics to uncover what the tabular data cannot see
The spatial statistics tools in ESRI's ArcGIS facilitate an exploratory technique to examine the distribution and pattern of various geographic phenomena and events.
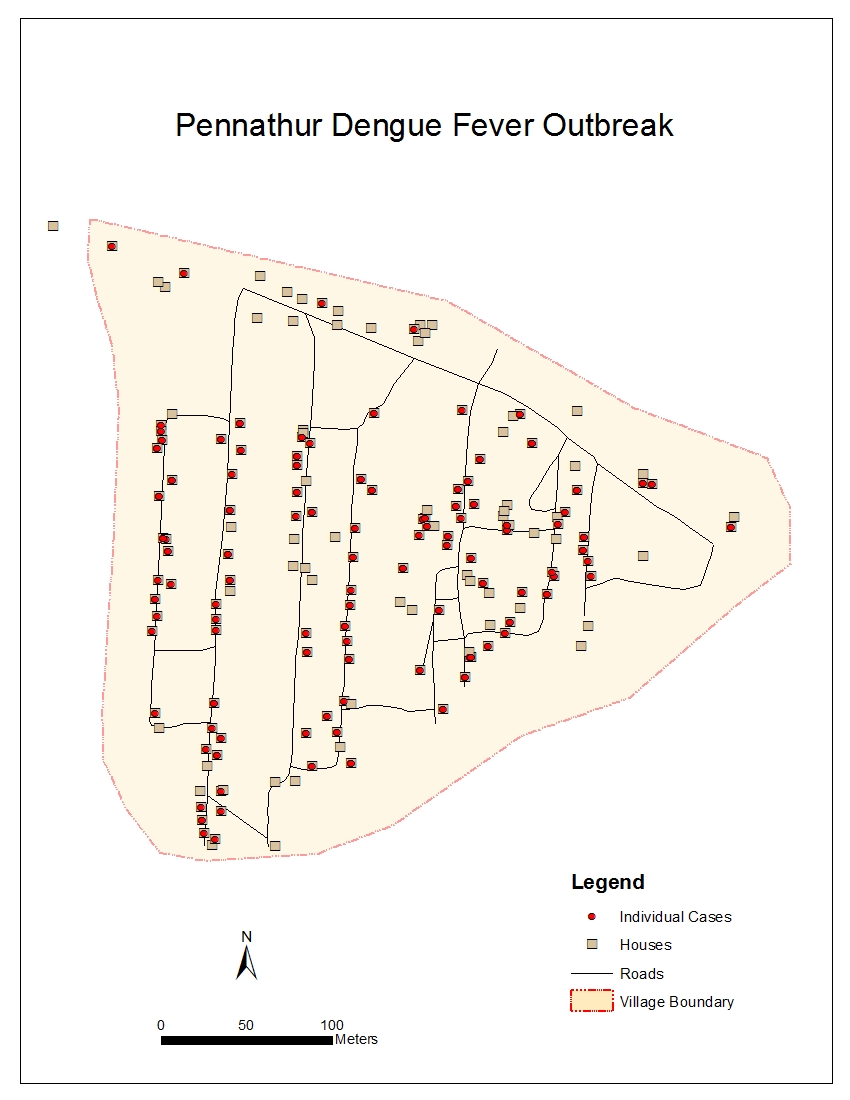
During a six week period in the summer of 2001, dengue fever spread through Pennathur, India. The disease was transmitted by mosquitoes resulting in 294 people contracting the dengue fever. In this example, we will explore how the disease spread through the village and if there are any statistically significant patterns and distrubutions.
*Adapted from Introduction to Spatial Statistics for ArcGIS, Exercise 10, ESRI copyright 2007
Analysis Procedures
Gather raw spatial data and look at it
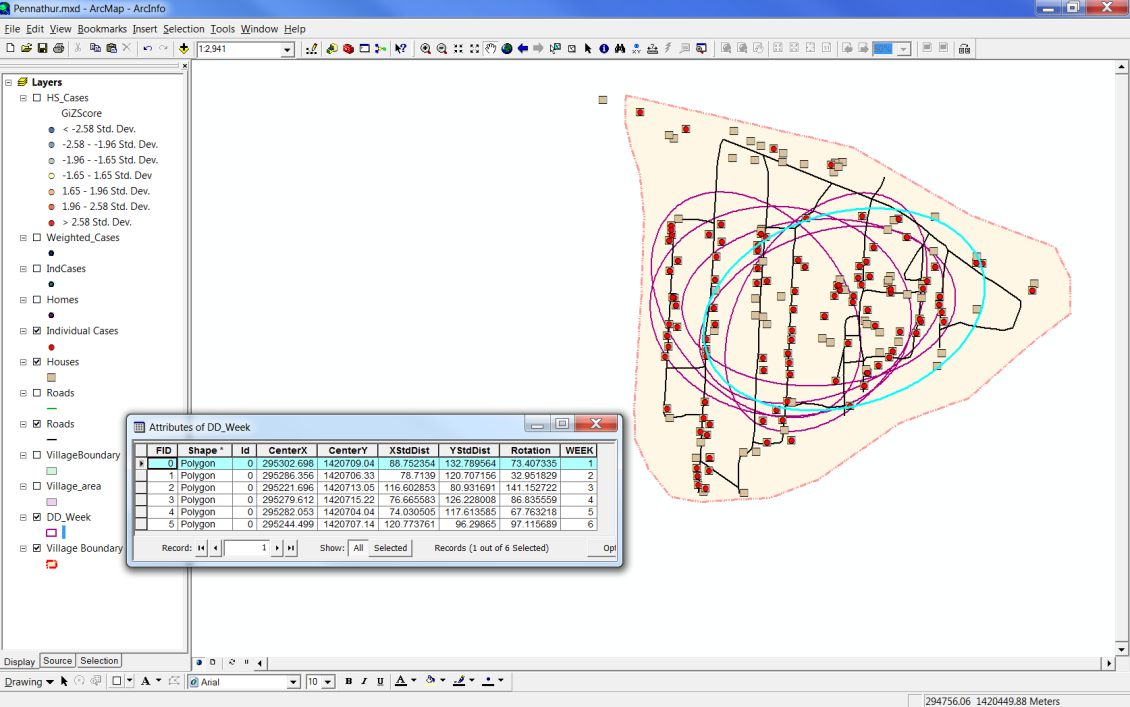
Conduct Directional Distribution analysis
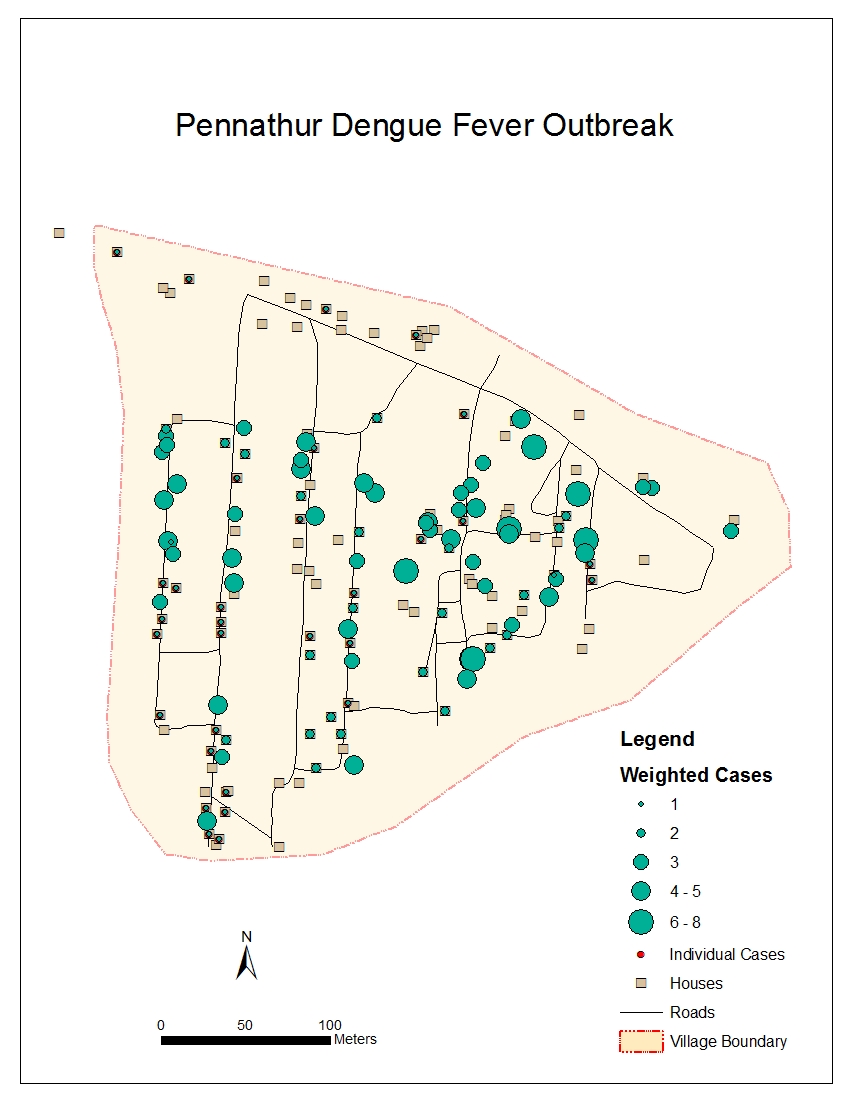
Calculate weighted cases
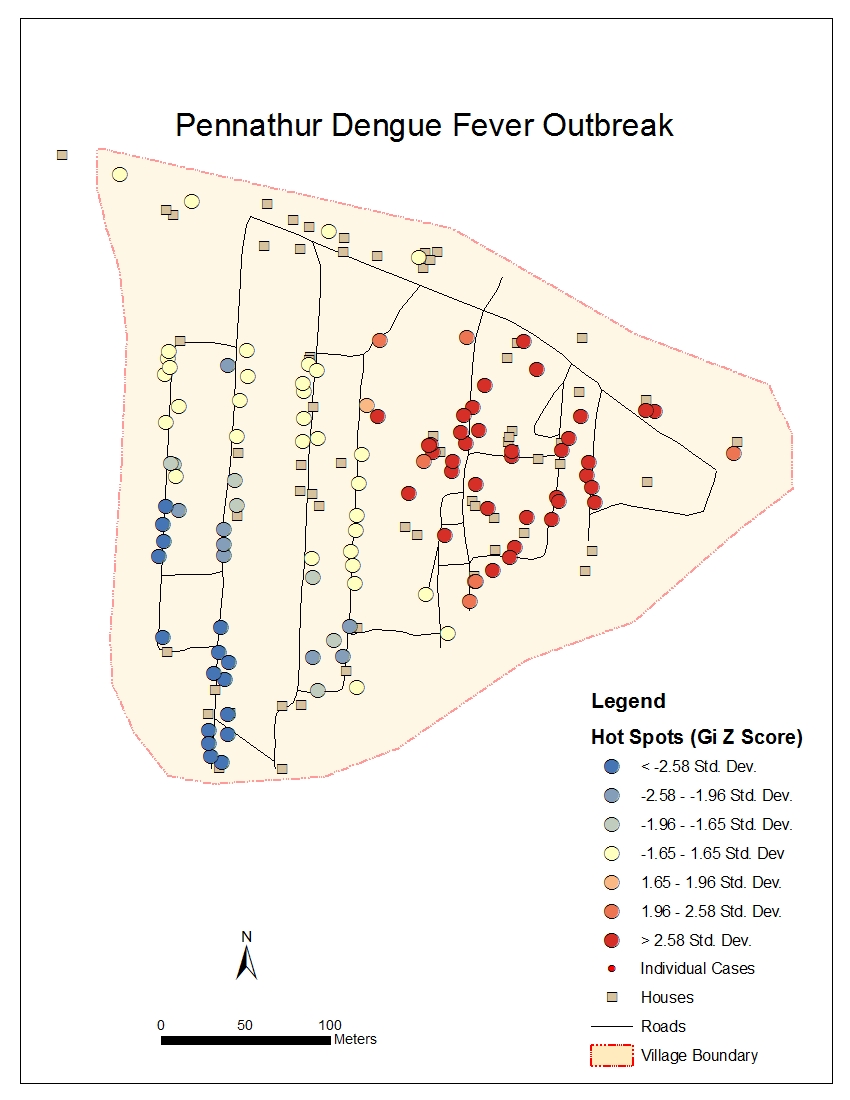
Conduct Hot Spot analysis and clustering
Based on plotting the raw data, it is clear where the cases of dengue fever occurred, but no patterns jump out that allow us to make any conclusions about how the disease spread throughout the village. Using the Average Nearest Neighbor statistic (global statistic) reveals that the house clustering is statistically significant at the 0.01 significance level. In other words, we are 99% confident that the clustered pattern of the houses is not random. We conduct the same Average Nearest Neighbor statistic on the dengue fever data which reveals that the dengue is more tightly clustered than the houses. From this analysis, we can conclude that there are underlying spatial processes at work which increase the risk of contracting dengue for individuals in contact with those already infected.
The rotation field in the attribute table provides the axis direction by week. The Directional Distribution tool provides an indication of the direction of the disease movement.
A weighted data analysis is conducted to determine the number of the cases by house.
Conducting a Hot Spot Analysis reveals a statistically significant clustering of dengue fever cases in the eastern portion of the village. Further analysis could help determine the cause of the outbreak. Determining the age group affected, building materials, and stagnant water may provide additional insight.
Applications
Geostatistical analysis is a useful modeling tool to interpolate a continuous surface (e.g., a landscape). This type of analysis could model the effects of an oil spill or a toxic plume emitted from an energy plant. An application such as used in the example above would be invaluable to the Center for Disease Control (CDC) to track reports of an outbreak, such as the Swine Flu virus.