| |
| Home |
| Model Builder |
| Python and VBA Programming |
| Database Operations |
| Geodatabase |
| ArcServer |
| Data Sources |
| GeoStatistics |
| Training Certificates |
![]()
Data Sources
Conducting GIS analysis using publicly-available data
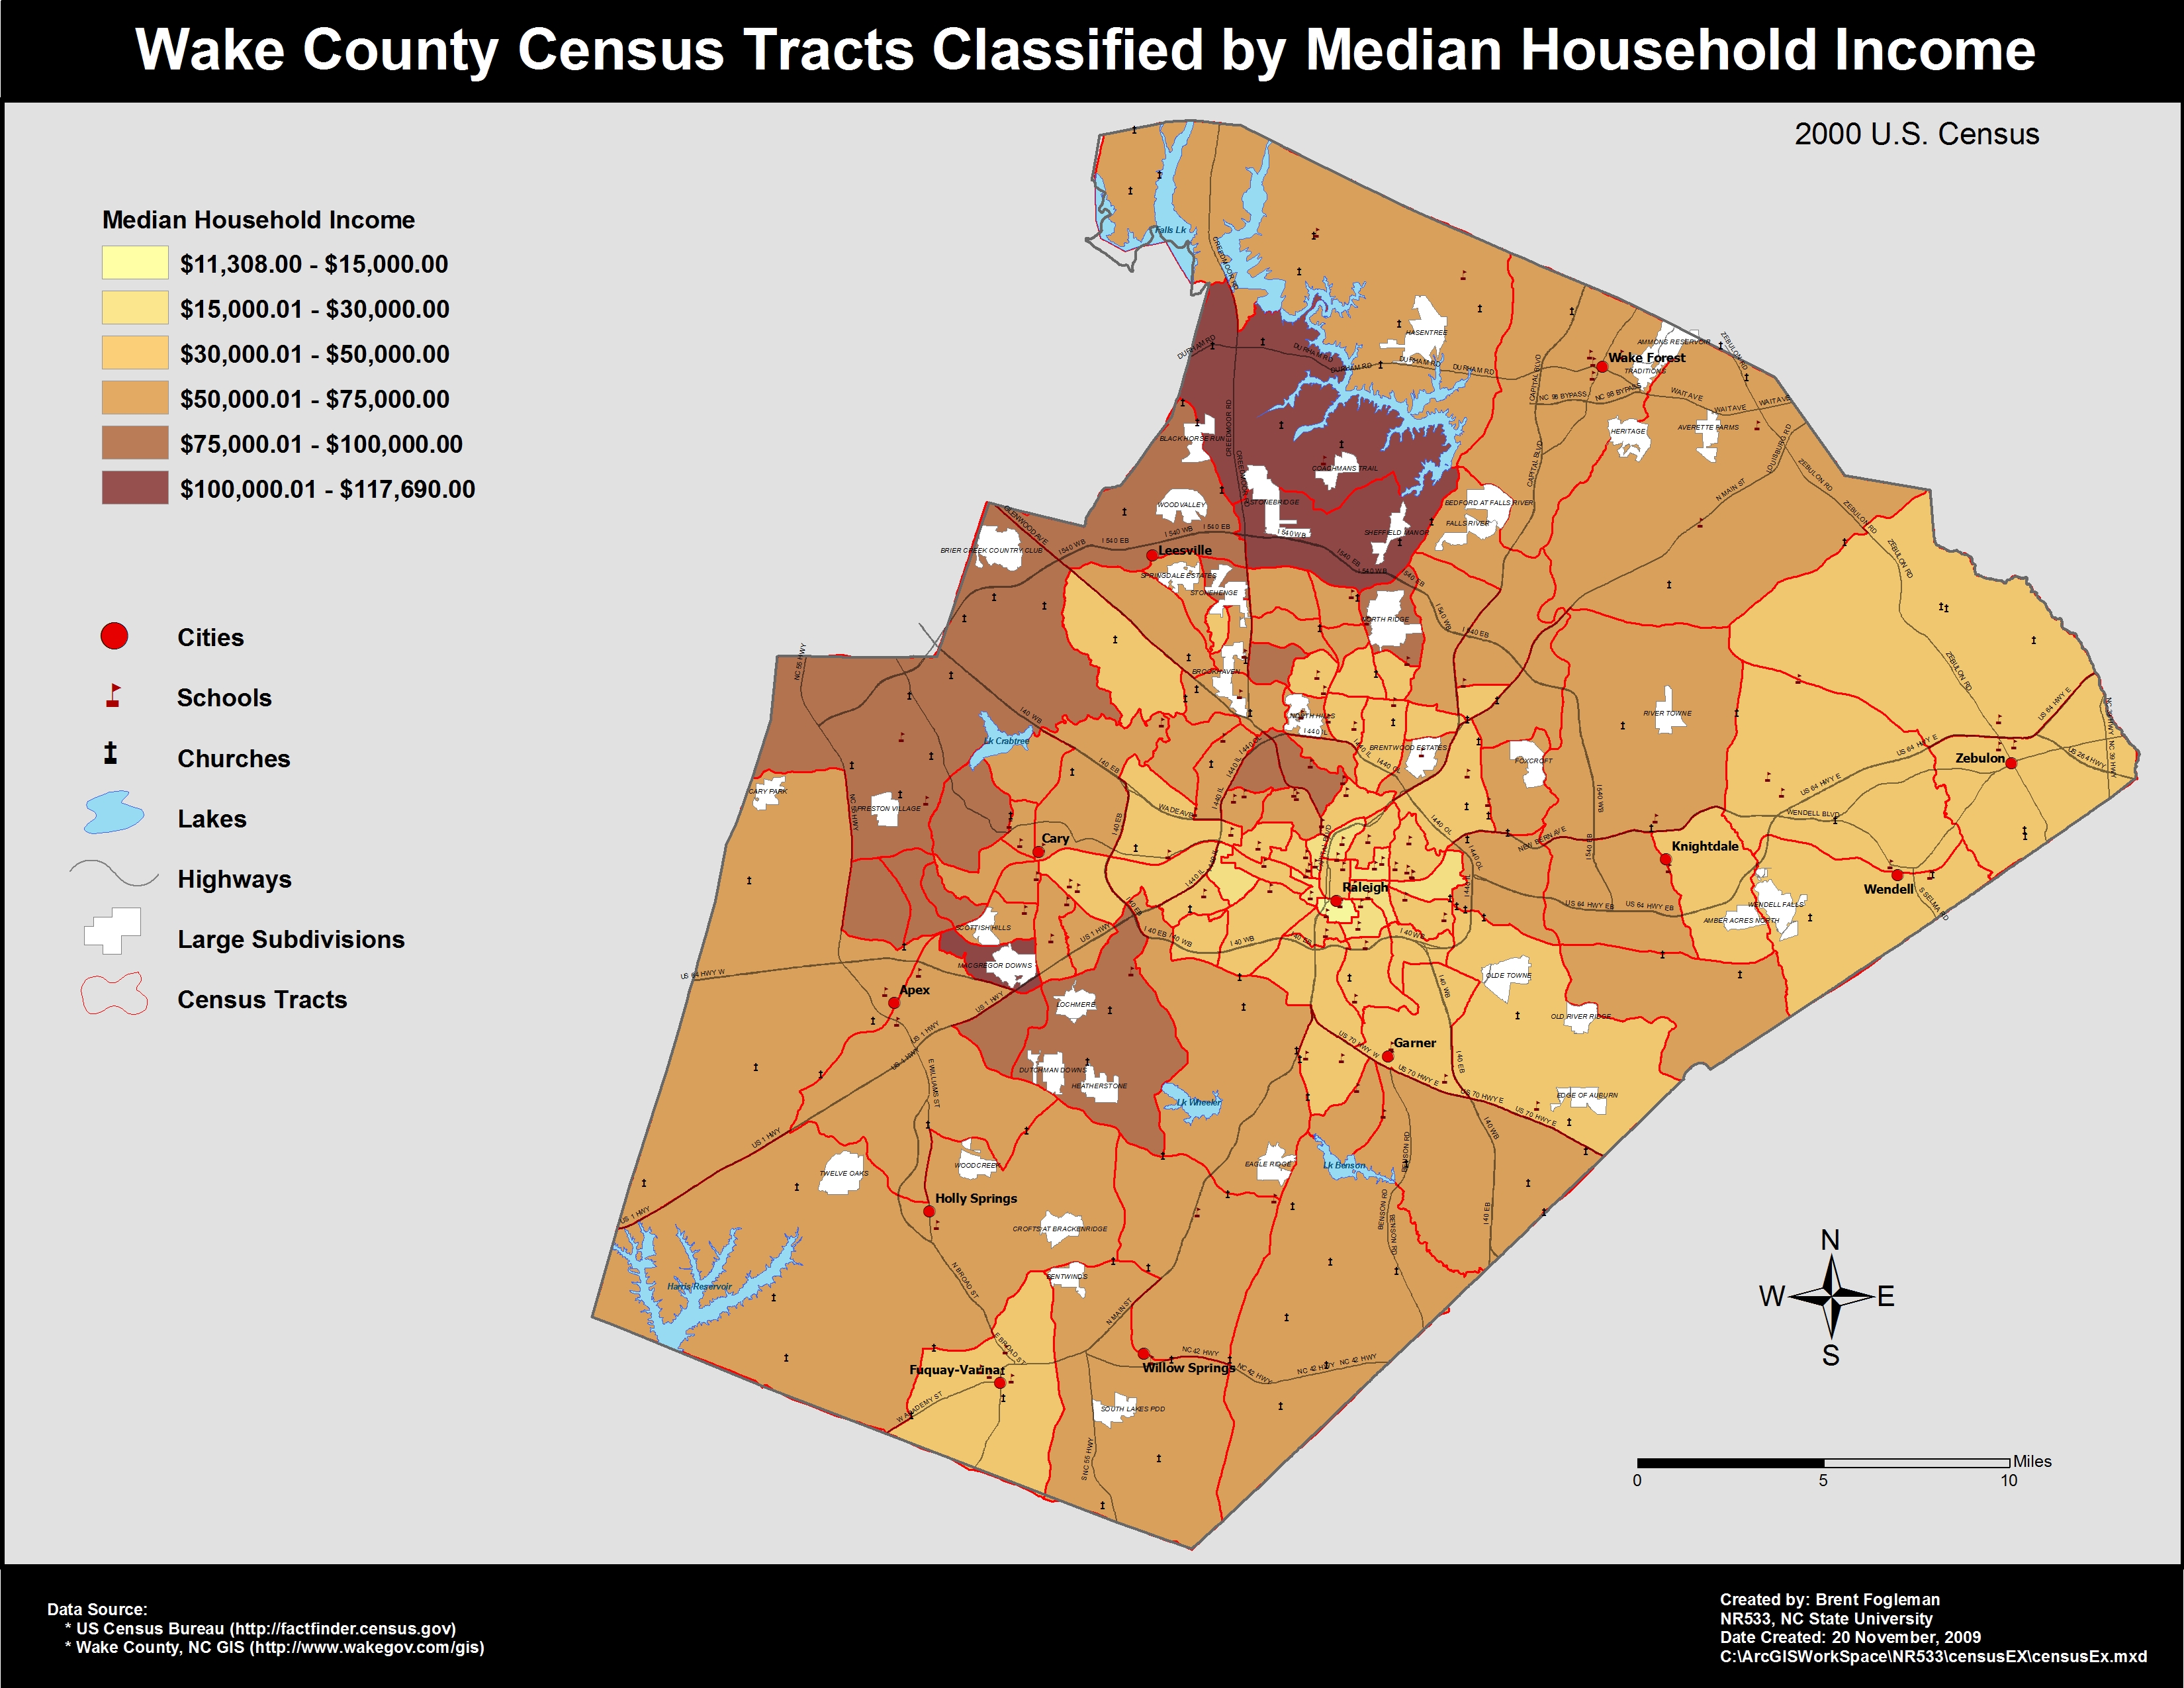
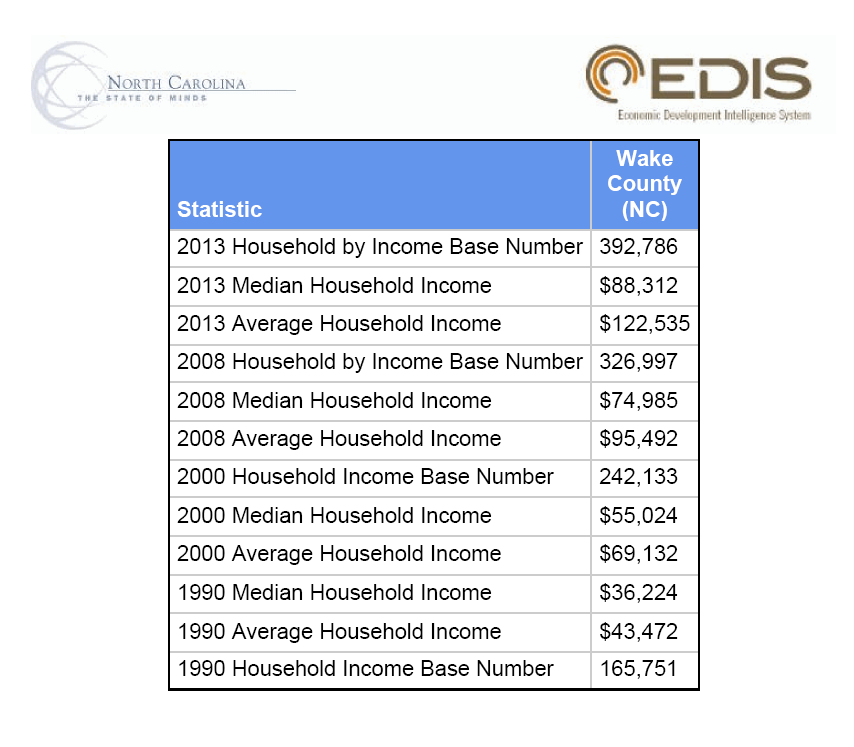
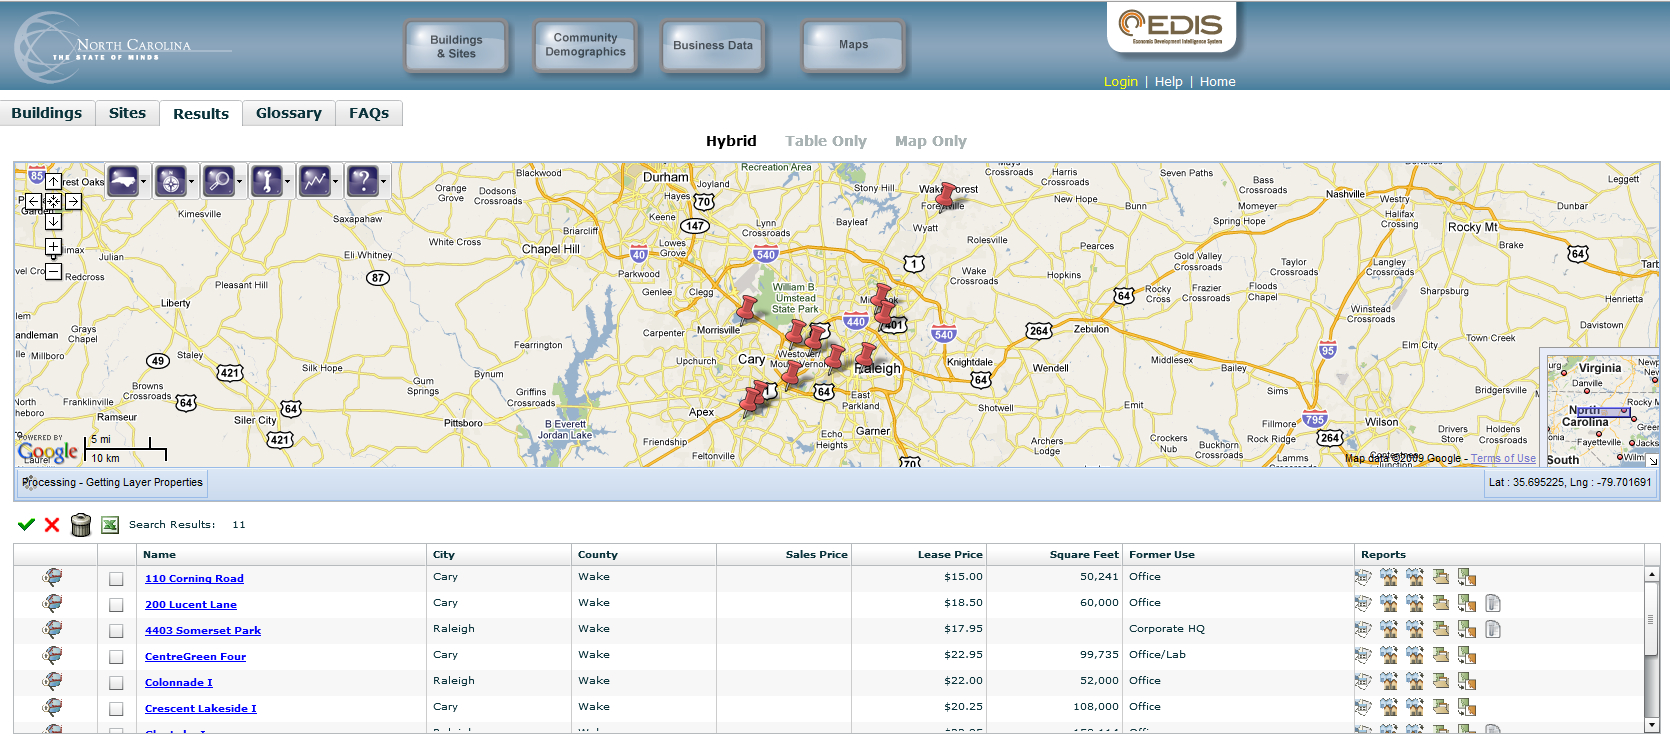
There are many GIS data sources easily accessible from the worldwide web. This topic demonstrates the kind of analysis that can be conducted from two such sources. The first is an income analysis where tabular income data from the U.S. Census Bureau (http://factfinder.census.gov) was combined with U.S. Census TIGER shapefiles and county GIS data to determine income levels in Wake County, NC. The second analysis was conducted using data from the North Carolina Economic Development Intelligence System (EDIS) website (https://edis.commerce.state.nc.us/EDIS/page1.html) EDIS queries can provide quick access to community demographics and business data. It will also generate maps of certain queries.
Analysis Procedures
Census Data:
Download tabular income data in .csv format from the American Factfinder website
Import .csv file in Microsoft Excel and reformat for use in ArcMap
Download TIGER shapefiles (i.e. census tracts)
Download Wake County GIS shapefiles (i.e. major roads, lakes, schools, churches, subdivisions)
Add map features
Conduct a spatial join of tabular data and spatial data based on common field
Select only certain features for display (i.e.major roads, large bodies of water, and large subdivisions)EDIS Data:
Create income reports for Wake County (past and projected)
Create a map depicting office buildings in Wake County availabe for lease
Click to enlarge
Click to enlarge
Applications
The U.S. Census Bureau maintains significant quantities of information that can be analyzed with GIS for more comprehensive understanding. Tabular data does not always stand out, but analyzing the spatial aspects can often bring to light facts that were not otherwise apparent. The EDIS website is a useful planning tool for employers and prospective employees looking for jobs in NC.