Modeling
| |
| Home |
| Tangible Geospatial Modeling |
| > Case Study |
| > Model Building |
| > Scan and Analyze |
![]()
Scan and Analyze
Working with Modeled Data
After the physical model is constructed, the next step is to scan it using a laser scanner and analyze the results.
Modeling Procedures
The model is scanned using a laser scanner. The scanner returns about 300,000 points, each of which has a corresponding x,y and z coordinate. The scanned points are in "scanner coordinates", or relative coordinates. This means that the coordinates are not projected in any useable map projection. Several calculations must be conducted to determine a scaling factor for the x and y coordinates and a separate scaling factor for the z coordinates. Once the scaling factors are determined, they are incorporated into a shell script which is executed on the data set to create correctly scaled coordinates. The newly georectified and scaled coordinate file can now be interpolated in the same manner as the LIDAR point data to create the digital elevation model, or surface model. The model can be verified against the real-world DEM by conducting a raster map algebra operation in which the difference in elevation between the two DEMs is determined.
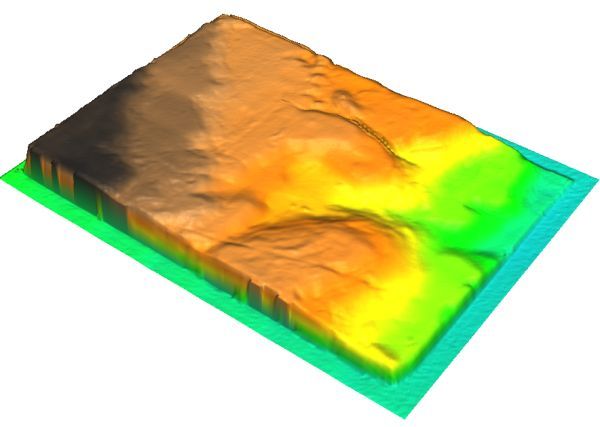
A 3D visualization of the scanned model prior to any scaling or cropping.
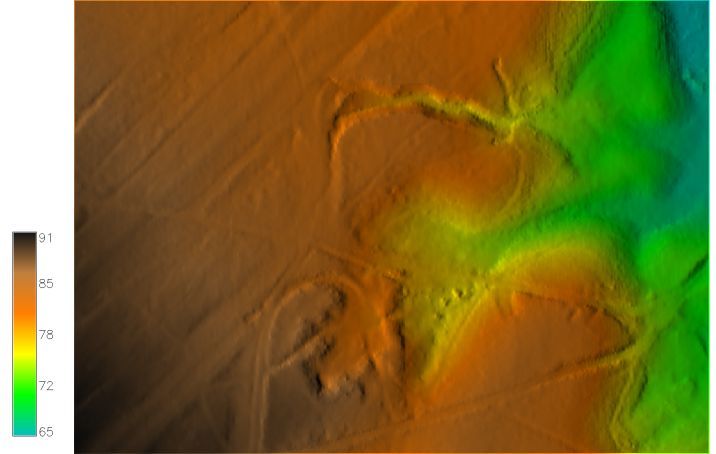
The real-world DEM interpolated at 1-meter resolution from LIDAR data and the 3D visualization.
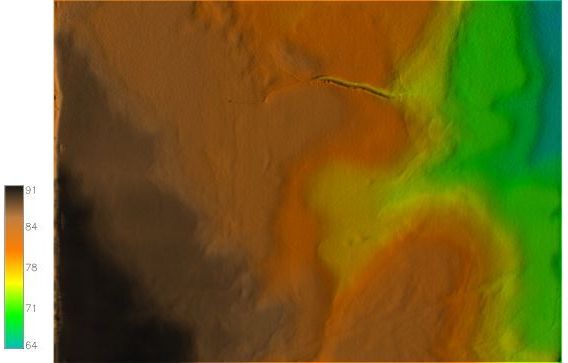
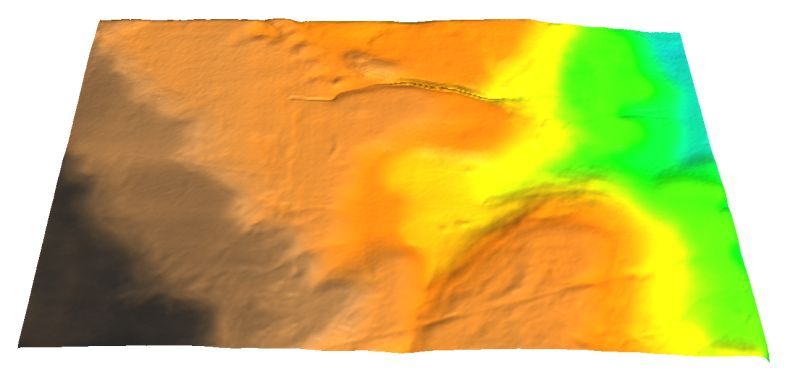
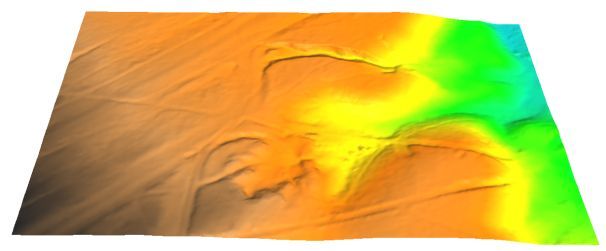
The model DEM interpolated at 0.5-meter resolution from scanned data and the 3D visualization.
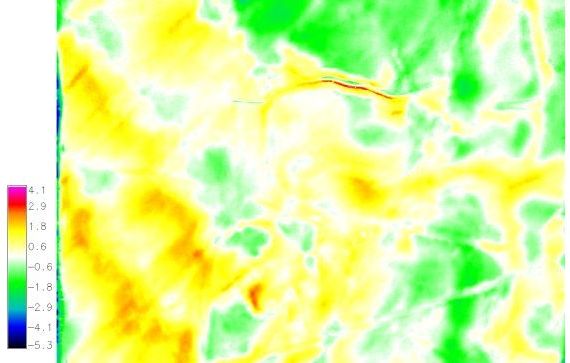
The resultant raster map after subtracting the real-world DEM from the model DEM shows the elevation difference in meters between the two DEMs. Positive values indicate areas on the model that are too high (too much clay). Negative values indicate areas on the model that are too low (clay must be added). White indicates areas on the model where the elevation is within +/- 1.5 meters of the real-world DEM values. This map provides important information that can be used to further refine the model if required.
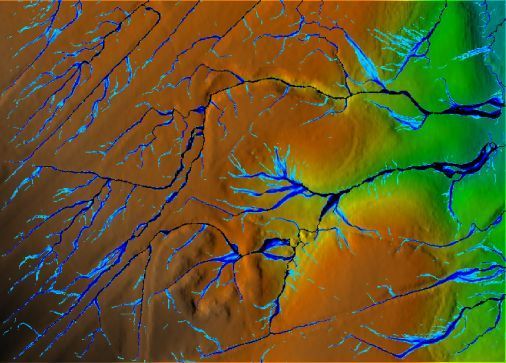
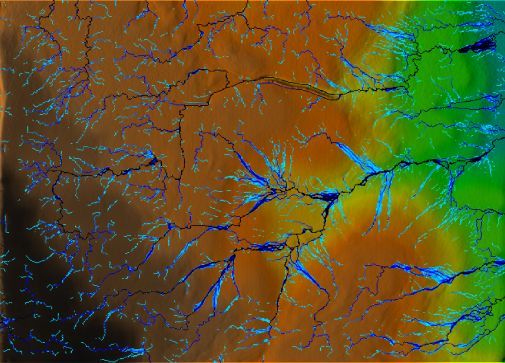
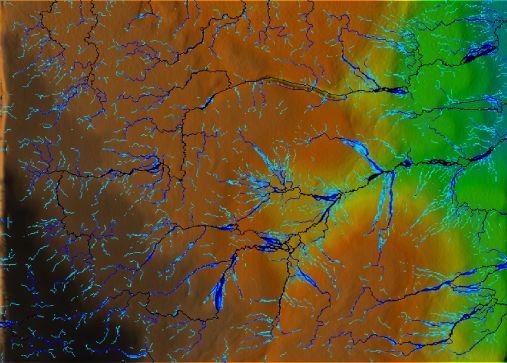
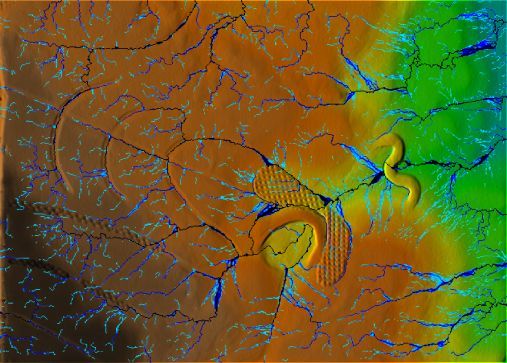
LEFT: Real-world DEM with high flow values displayed.
RIGHT: Initial model scan with high flow values displayed..
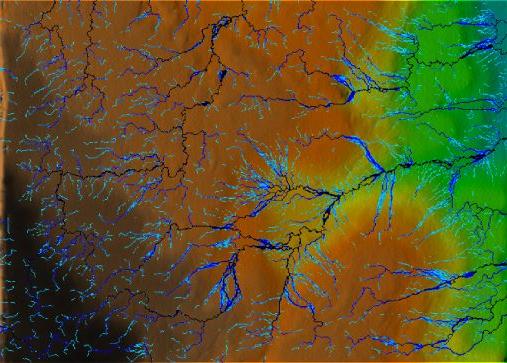
LEFT: Model modification: no drainpipe.
RIGHT: Initial model scan.
LEFT: Model modification: badly eroded gully is filled.
RIGHT: Initial model scan.
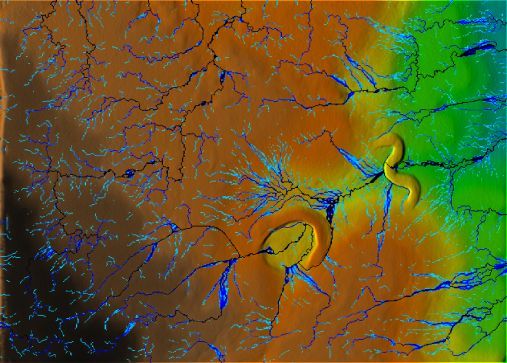
LEFT: Model modification: gully filled, pond and dam added.
RIGHT: Initial model scan.
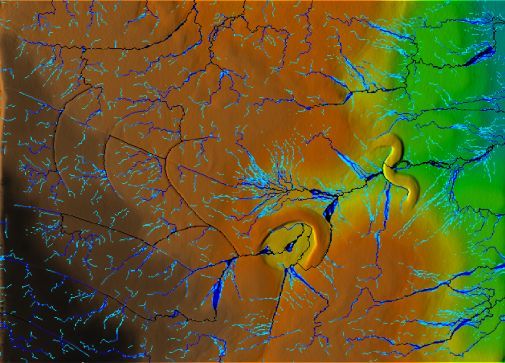
LEFT: Model modification: gully filled, pond and dam added, drainage ditches dug to redirect flow.
RIGHT: Initial model scan.
LEFT: Model modification: gully filled, pond and dam added, drainage ditches dug to redirect flow and textured surfaces added.
RIGHT: Initial model scan.